
AI Router Observability: Every Call, Every Token, Every Dollar
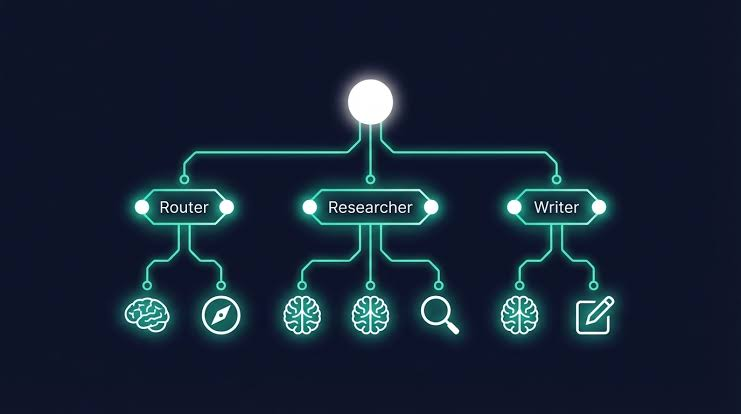
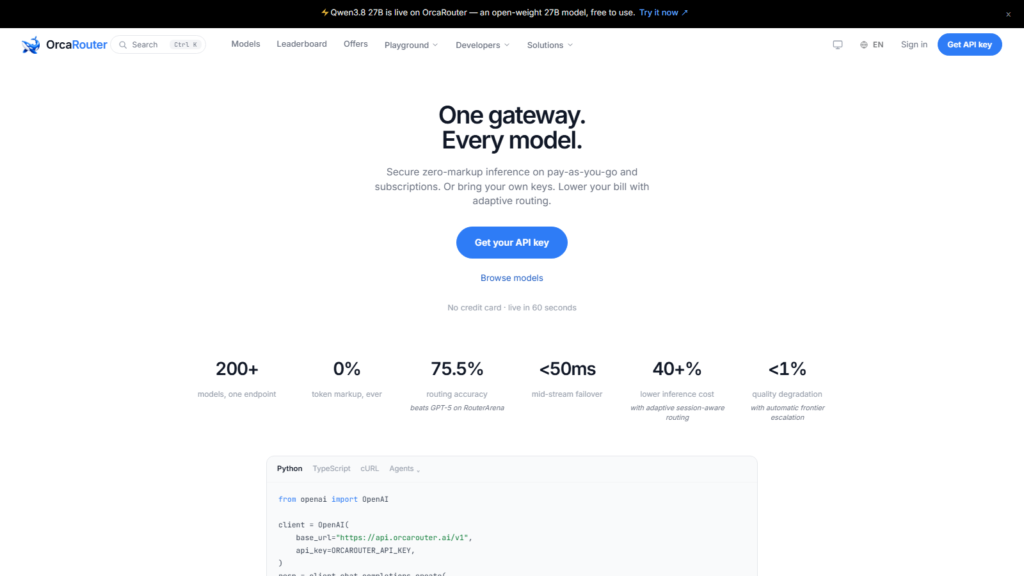
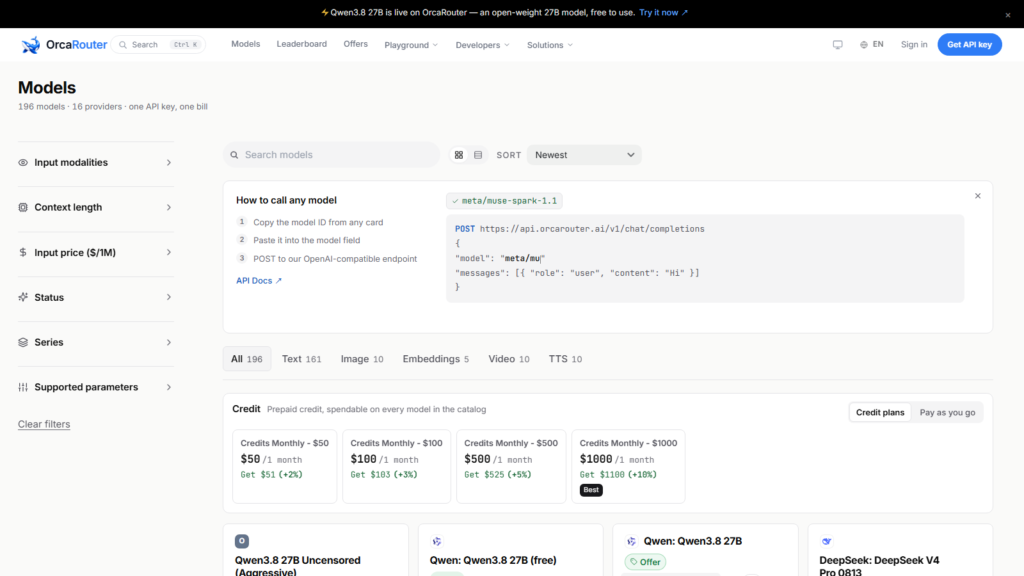
Model calls are the part of your system you understand least and bill for most. An AI router fixes that by being the chokepoint every request passes through — which means it can record every call, every token, every dollar. OrcaRouter is one platform built around this pattern.
What a router can see
Because every request goes through the router, it is the natural place for observability:
• Which model answered — for routing accuracy and audit.
Tokens used — input and output, including reasoning tokens.
• Cost — at the vendor’s list price, per request.
• Latency — time to first token and total, per model and per task.
That data answers the questions teams constantly ask: what did we spend on Claude vs GPT, which model is actually fastest for classification, where is the slow tail, which team is burning the budget.
Why this beats bolting it on
Instrumenting model calls from inside your application is a per-codebase observability project, and it misses what you do not instrument. The router sees everything by construction, so the record is complete, consistent and free of per-team gaps.
Turning data into decisions
Observability is only valuable if it changes what you do. The per-call record from a router converts into three decisions: which models to keep in the pool, which routing rules to tighten, and which teams to budget. A model that appears expensive in the per-call record but never gets used gets removed; a task type that turns out to clear fine on a cheap model gets a cheap-first rule; a team whose spend is climbing gets a budget before it becomes a surprise. The data the router records is not for logging’s sake — it is the feedback loop that makes the routing rules better every week.
The single most useful report
If you generate one report from the router’s data, make it cost per task type per model. That single table tells you which model earns its place, which workload is over-provisioned, and which routing rule to tighten next. Every other observability question — latency, failure rates, team spend — is a slice of the same record. The router records it all because it sees every call; the report makes that record useful. Without the record, model cost is a mystery; with it, it is a set of decisions you can make and measure.
From logs to decisions, fast
The value of the record is only realised when it becomes decisions quickly. A router that tells you on Monday that a model has drifted in latency or cost lets you adjust the pool on Tuesday, before the problem compounds. Teams without the record discover the drift when the invoice or the p99 alert arrives. The difference between “we react to model problems” and “we see them forming” is exactly the per-call record. That is why observability is not a dashboard feature; it is the feedback that keeps the routing rules honest and the pool current.
The observability that pays for itself
Observability is usually sold as a cost centre; for LLM work it is the opposite — it is where the payback lives. The per-call record a router keeps answers the questions that actually move money: which model is earning its place in the pool, which workload is over-provisioned on an expensive model, where the latency tail lives, which team is spending what. Teams without that record make model decisions on vendor marketing and gut feel; teams with it make decisions on data, and the data usually says “this task type clears on a cheaper model” or “this model has not earned a single request in a month.”
The record also changes how you respond to incidents. When a response degrades, the router’s log shows the model, the prompt shape, the tokens, the latency — the whole picture of one request, in one place. Debugging an LLM issue becomes a lookup instead of a hunt across five vendor dashboards. That is worth real money in engineering time, and it is the reason the router’s observability is not a dashboard nicety but the feedback loop that keeps the whole system tuned.
None of this requires building anything. The router records because it is the chokepoint; the reports are slices of the same data. The team that adopts a router for cost or failover usually discovers that observability is the feature they reach for most, because it turns every model decision into something they can see and defend. That is the quiet way the routing layer pays for itself.
The takeaway
Observability for LLMs is “every call, every token, every dollar,” and an AI router provides it by being the layer every request passes through. Model used, tokens, cost and latency are recorded per request, giving you the reports you need without building an observability pipeline in your application. For teams that bill, budget or audit against model usage, that single view is worth the routing layer by itself.
Sourcing note: this article describes the AI-router category and OrcaRouter’s implementation. Per-request logging of model, tokens, cost and latency is OrcaRouter’s own published description, checked August 2026.